

Traffic Safety Dashboards and Maps
High Injury Network
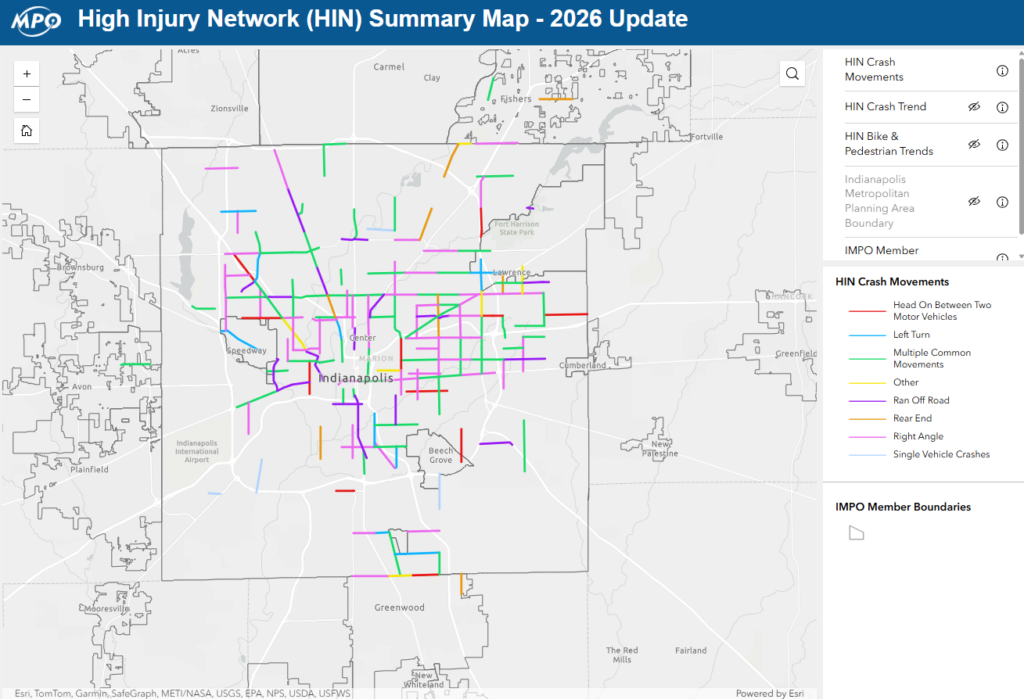
This interactive map includes 3 different High Injury Network (HIN) layers you can choose to display – Crash Movements, Crash Trends, and Bike/Pedestrian Trends.
Crash Dashboard
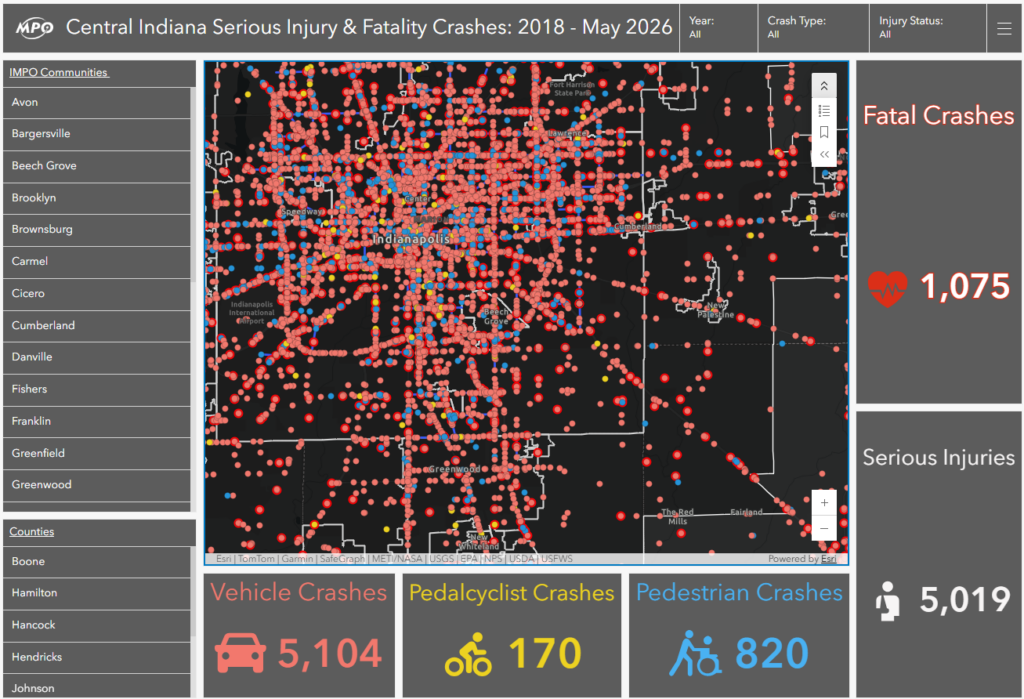
This dashboard visualizes crashes involving vehicles, bicyclists, and pedestrians. The data has been reviewed and corrected for accuracy from eight counties in Central Indiana (Boone, Hancock, Hamilton, Hendricks, Johnson, Marion, Morgan, & Shelby). Users can filter on a specific type of crash, a particular year, or a specific community. Users can also click on a specific crash to see further details.
Vulnerable Road User Crash Dashboard
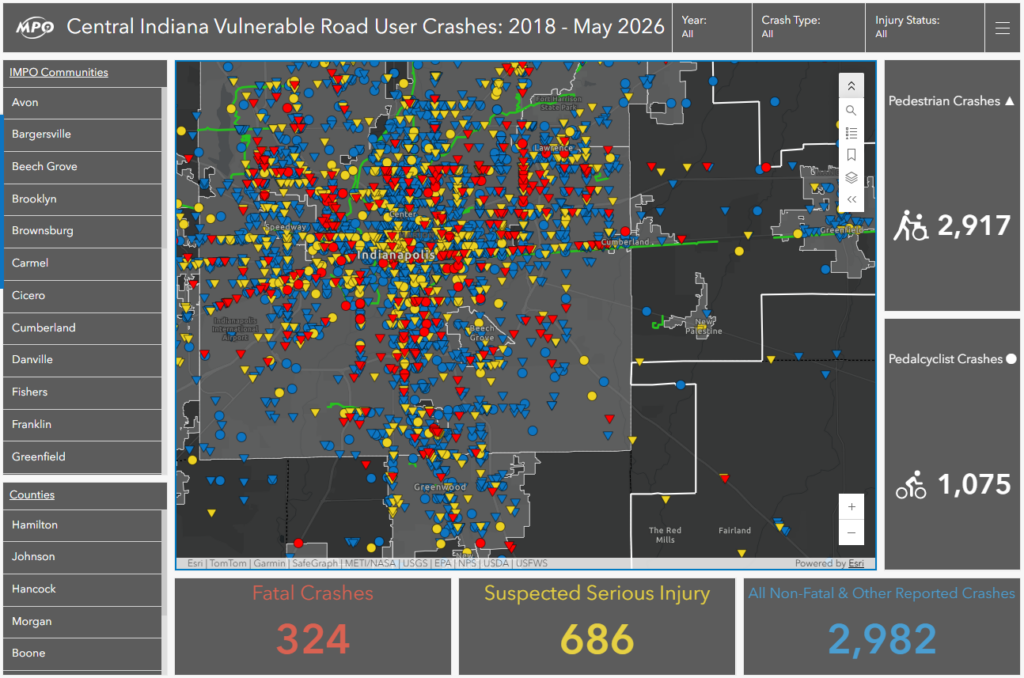
This dashboard visualizes all crashes involving bikes and pedestrians. Often, these individuals fall under IMPO’s Vision Zero definition of a vulnerable road user. Tracking and reporting this data is an important step to make progress on the goals of Vision Zero. The data has been reviewed and corrected for accuracy from eight counties in Central Indiana (Boone, Hancock, Hamilton, Hendricks, Johnson, Marion, Morgan, & Shelby).